Author: Mengyang Lin, Jin Cao, Xuan Sun
Abstract
Consumption-oriented capital asset pricing model (CCAPM) by Breeden (1979) is a financial model that extends the concepts of the traditional capital asset pricing model (CAPM) to include the consumption to measure the risk of a security by the covariance of its return with per capita consumption. It has become one of the most popular asset pricing models in the last 20 years. However, few previous research focuses on the simulation of the error terms of these asset pricing models. In this paper, we include the AEPD into the CCAPM to study its power. Nice properties of AEPD in CCAPM are found and always generate a better-fitting model.
Keywords: Consumption-oriented capital asset pricing model, asymmetric exponential power distribution
1. Introduction
Consumption-oriented capital asset pricing model (CCAPM) by Breeden (1979) has been one of the most popularly used asset pricing models to measure the risk of a security by the covariance of its return with per capita consumption. This covariance is known as the consumption beta. The expected equity premium here is proportional to the consumption beta. Compared to capital asset pricing model (CAPM) by Lintner (1965) and Sharpe (1964), CCAPM is actually more important than the CAPM due to its integral role in modern macroeconomics. Nonetheless, the existing literature reports that the standard CCAPM model cannot explain the asset return in US by Breeden, Gibbons, Litzenberger (1989), Mankiw and Zeldes (1991) and Campbell and Cocherane (2000).
Although previous literature has shown different reasons for not very good results got from CCAPM, most of the empirical tests of the CCAPM have only be conducted based on the assumption that the error term follows normal distribution. There has been unexpectedly limited research in the distribution of error term of asset pricing models. Thus, in this paper, instead of normal distribution, we assume that the error term follows asymmetric exponential power distribution (AEPD) when constructing the CCAPM and explore whether the results get improved. The reason why we use assumptions of asymmetric exponential power distribution is that AEPD has features of fat tails and skewness, which are essential to describe financial data. Zhu and Zinde-Walsh (2009) have done research on the probability density function of AEPD as well as its fatness and skewness, and proposed a method to generate AEPD random numbers. Jin (2011) incorporates AEPD into capital asset pricing model.
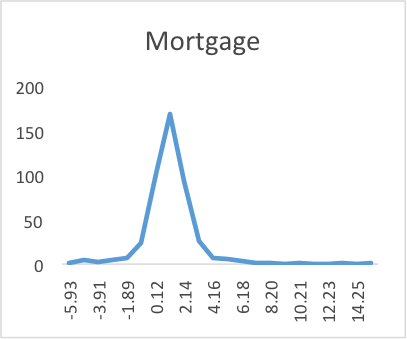
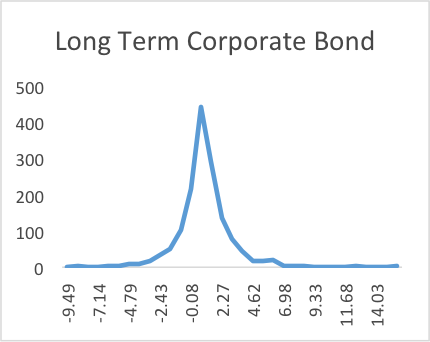
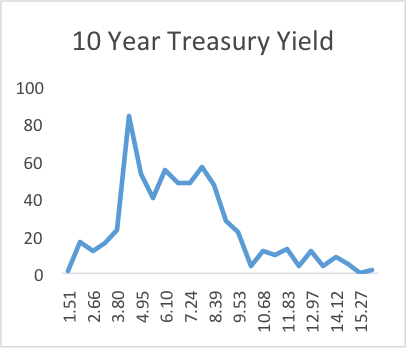
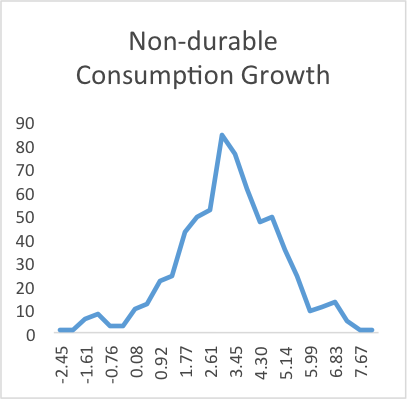
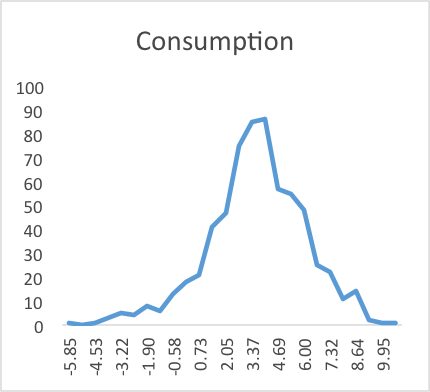
In addition, we also find empirical evidence against the assumption that the error term in the CCAPM follows normal distribution. As shown in Table I and Graph I, consumption growth, nondurable consumption growth and BBB Corporate bond returns are negatively skewed while mortgage, long-term corporate bond and 10-year treasury yield show positive skewness. Besides, mortgage, long-term corporate bond and BBB corporate bond all have a kurtosis more than 3 and show fat tails in Graph I, while nondurable consumption, consumption and 10-year treasury yield have a kurtosis less than 3. All these are inconsistent with the normal distribution, which has a skewness of 0 and a kurtosis of 3, and thus support our assumption for the error term in CCAPM to follow AEPD.
The negative skewness of BBB Corporate bonds indicates the nonlinearities of credit put option as well as the associated changing betas. Also, the positive skewness of 10-year treasury yield is consistent with the positive convexity of treasury notes. Long-term corporate bond shows slightly positive skewness, which may be because it contains not only junk and BBB bonds but also higher rated bonds and are thus more like treasury. Surprisingly, mortgage return shows positive skewness, which is contrary to the theory of prepayment option in mortgage. This may be because the Mortgage Master Merrill Lynch (M0A0) we used for mortgage return tracks the performance of all US dollar-denominated fixed rate and hybrid residential mortgage securities and consists of mortgages with different coupon rates, which would affect prepayment and mortgage returns and thus may lead to the positive skewness in mortgages.
Table I: Skewness and Kurtosis of Consumption, Nondurable Consumption, Mortgage, Long-term Corporate bond, 10-year Treasury and BBB Corporate Bond
| Skewness | Kurtosis | |
|---|---|---|
| Consumption | -0.39522 | 0.817986 |
| Nondurable Consumption | -0.26411 | 0.498609 |
| Mortgage | 1.601288 | 14.1077 |
| Long Term Corporate Bond | 0.700779 | 7.111248 |
| 10 Year Treasury Yield | 0.785187 | 0.505254 |
| BBB Corporate | -0.36899 | 13.29386 |
Graph I: The Empirical Distribution of Consumption, Nondurable Consumption, Mortgage, Long-term Corporate bond, 10-yr Treasury and BBB Corporate Bond
2. Model and Methodology
The CCAPM-AEPD is proposed by assuming errors distributed as Asymmetric Exponential Power Distribution (AEPD). For convenience, we denote this model as CCAPM-AEPD. The CCAPM-AEPD model is given by:
$$$r_t = \beta_1 + \beta_2 c_t + u_t, u_t ~ AEPD(\alpha, p_1, p_2, \mu, \sigma^2 )$$$
where the AEPD density function has the following form:

$$$K_{EP} (p) = 1/[2p^{1/p} \Gamma (1+1/p)]$$$
$$$p_1 >0, p_2 > 0$$$
$$$ \alpha \in (0,1)$$$

$$$p_1$$$ controls the left kurtosis, $$$p_2$$$ controls the right kurtosis and $$$\alpha$$$ is the parameter of skewness.
When the parameters satisfy the condition that $$$\alpha = 0.5, p_1=p_2=2, \mu = 0, \sigma=1$$$, and thus $$$\alpha = \alpha^*$$$, the function of AEPD turns out to be

The parameters of CCAPM-AEPD and CCAPM have the same meaning: $$$r_t$$$ is the asset return and $$$c_t$$$ is the consumption growth return. $$$\beta_1$$$ and $$$\beta_2$$$ are two parameters to estimate: $$$\beta_1$$$ is the intercept and $$$\beta_2$$$ is the coefficient of the function. $$$u_t$$$ is the error term of CCAPM function.
Since we change the assumption of the distribution of error from normal distribution to asymmetric exponential power distribution, we use maximum likelihood estimation method to estimate parameters instead of ordinary least square method. The likelihood function is

In order to show the advantage of this model, we compare the model with CCAPM with normal distribution assumption.
3. Empirical Test: CCAPM-AEPD vs CCAPM
3.1 Data
In this paper, to do the empirical test, we use two different consumption growth: total consumption growth and total nondurable consumption growth. Nondurable consumption on a semiannual basis could be food, clothing and shoes, housing, utilities, transportation, and medical care, while durable consumption could be motor vehicles, furniture and appliances and jewelry and watches. Housing is the service flow inputted from the rental value of houses.
As Breeden, Gibbons and Litzenberger (1989) and Yogo (2006) indicate, the empirical test of CCAPM should use nondurable consumption to do the regression. “When utility is nonseparable in nondurable and durable consumption and the elasticity of substitution between the two consumption goods is sufficiently high, marginal utility rises when durable consumption falls.” Thus, nondurable consumption could be a better indicator of optimistic view of market. However, non-durable consumption data may not be very accurate, since the data available is measured as average consumption over an interval of time and the length of nondurable consumption data is relatively short. Small sample will increase type II error and decrease the significance, thus we use total consumption, which has longer time period in this model as well.
The data is gathered from Professor Douglas T. Breeden in Duke University.
3.2 Method
We use CCAPM-AEPD and CCAPM model to do the empirical test simultaneously. We estimate the parameter of CCAPM-AEPD using maximum likelihood estimation method, and estimate the parameter of CCAPM with error following normal distribution assumption as well. Under the normal distribution assumption, we fix $$$\alpha = 0.5, p_1=2, p_2=2$$$, and the AEPD distribution reduces to normal distribution. Under AEPD distribution assumption, as the model is robust, we set initial number of $$$\alpha$$$, $$$p_1$$$ and $$$p_2$$$ and get estimated parameters. The likelihood function of normal distribution assumption is:
$$$L(rt, c_t;\theta)= \prod{i=0}^{n} {1 \over {\sigma \sqrt {2 \pi}}} exp[{- {(u_t - \mu)^2} \over {2 \sigma^2}}]$$$
The likelihood function of AEPD distribution assumption is already given in the last function of 2. Model and Methodology.
3.3 Goodness of Fit
When applying maximum likelihood estimation, one can no longer use R-squared as criteria to do the model selection. To evaluate the goodness of fit, we use Akaike Information Criterion (AIC). Since there would always be information lost due to using a candidate model to represent the true model, we wish to select the model with least information lost. Though we cannot choose with certainty, we can minimize the estimated information lost. Generally, given the data set we have, the preferred model will give the smaller AIC value. In this paper, to offset the possible overfitting effect caused by 3 more parameters to estimate in CCAPM-AEPD model, we use AICc to evaluate the goodness of fit, because AICc has greater penalty for extra parameters. The function of AICc used in this paper is:
$$$ AIC = - {2 \over n} ln(L) + 2 {k(k+1)} / (n-k-1)$$$
where k is the number of parameters. As we can see in Table II and Table III, the AICc value of CCAPM-AEPD is always smaller than that of CCAPM model.
To quantify the improvement of CCAPM-AEPD relative to CCAPM, the relative likelihood, $$$ exp({(AIC_{min} - AIC_1)/ {2}})$$$ , can be used to interpret the relative possibility that the model minimizes the estimated information lost. We choose Junk Bond as an example. The relative likelihood of CCAPM is 0.66 since CCAPM-AEPD has a smaller AICc value. Then, we could say that CCAPM model is 0.66 times as probable as CCAPM-AEPD model to minimize the information lost. From Table II and Table III, the range of relative likelihood is from 0.00 to 0.93. For high relative likelihood, we may conclude that adding extra 3 parameters may be less advantageous because the loss minimized using a more complex model is not very big. However, when analyzing junk bond and long term corporate bond, CCAPM-AEPD has a much better performance. This may be because junk bond and long term corporate bond are more like equity, of which the error term has the properties of equity like fat tail and skewness and is thus more suitable for AEPD assumption.
3.4 Residual Check
The advantage of AEPD model can also be shown in the residual graph. By comparing the empirical distribution curve of the error term with the distribution curve of random numbers generated from different distributions, we could see whether the model explains the real data well. The random number is generated from Normal distribution or AEPD distribution with estimated parameter from empirical data. We still take Junk Bond for example.
Graph II: The distribution of the error term of junk bond in CAPM and random numbers from normal distribution
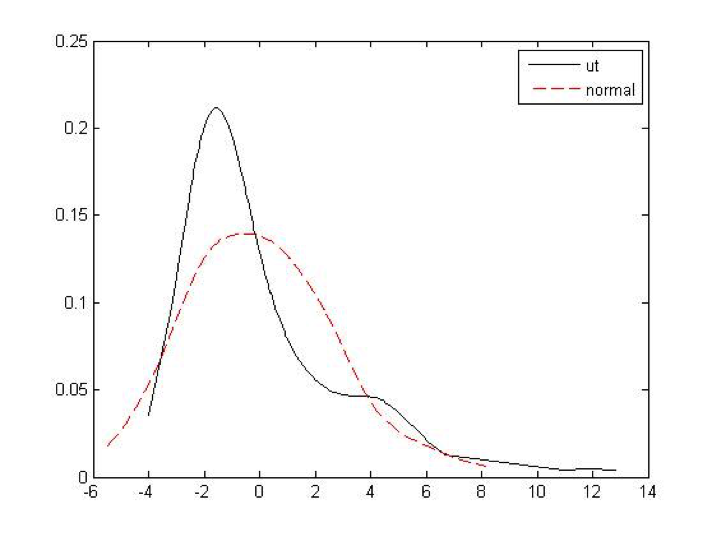
As graph II shows, the curve of the error term of junk bond is obviously different from the curve of random numbers from normal distribution. The curve of the error term has the characteristics of asymmetries and fatness. As far as we can see in the graph, it is not appropriate to say that the normal distribution tracks the error term very well.
Similar, we compare the distribution curve of the error term and the distribution curve of the random numbers generated from AEPD to see whether the model tracks t
he real data well.
Graph III: The distribution of the error term of junk bond in CCAPM-AEPD and random numbers from AEPD distribution
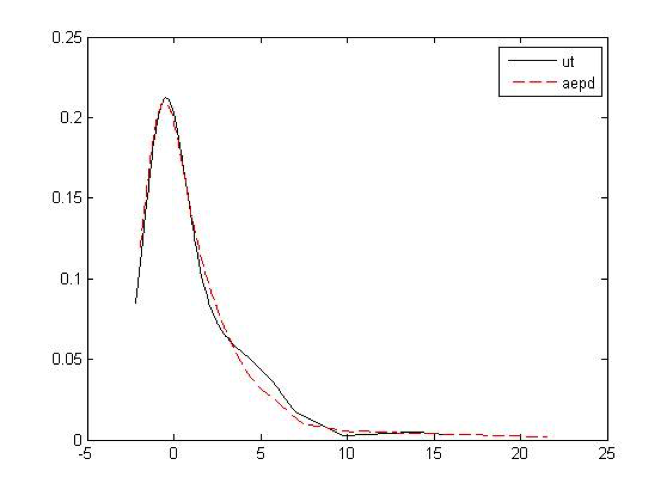
As far as we can see in the graph, the curve of the error term fits very well to the curve of the AEPD distribution random number. Comparing Graph III to Graph II, we can find that the CCAPM-AEPD model explains bond return data better than the CCAPM model does.
Graphs of residual check for other fixed income securities could be found in the appendix. For most of the bonds, the residual graph of CCAPM-AEPD has better fit than CCAPM.
3.5 Empirical Result
Table II and Table III show the results from two models. As shown in the tables, AICs does improve when using the CCAPM-AEPD model instead of the standard CCAPM model.
Using total consumption growth, the beta values of CCAPM and CCAPM-AEPD are very small, which indicates a weak correlation between the bond return and the growth rate of consumption. Using nondurable consumption growth, beta value changes the sign on long-term corporate bond and AAA corporate bond. In CCAPM model, the coefficient values of long-term corporate bond and AAA corporate bond are positive, while in CCAPM-AEPD model, the coefficient values of these two bonds become negative. This could be possibly explained by the substitution effect. When consumption growth rate increases, there is a large possibility that stock market will also increase, while capital assets like long term corporate bond and high ranking bond may remain unchanged. Thus, investors may not be as satisfied with the relatively low return provided by bond of the same company as the higher return provided by the stock. Therefore, the price of bond will be pushed down and gives a decreasing bond return. This tentative explanation needs further exploration.
Table II: CCAPM VS. CCAPM-AEPD using total consumption growth
| $$$\beta_1$$$ | $$$\beta_2$$$ | $$$\alpha$$$ | $$$p_1$$$ | $$$p_2$$$ | AICc | Relative Likelihood | ||
|---|---|---|---|---|---|---|---|---|
| Baa Corporate Bond | CCAPM | 2.192 | -0.063 | 0.50 | 2.00 | 2.00 | 2.84 | 0.90 |
| CCAPM-AEPD | 2.348 | -0.007 | 0.75 | 18.11 | 0.79 | 2.64 | ||
| Junk Bond Premium | CCAPM | 5.721 | -0.118 | 0.50 | 2.00 | 2.00 | 4.93 | 0.66 |
| CCAPM-AEPD | 4.304 | -0.023 | 0.19 | 1.23 | 0.70 | 4.09 | ||
| 10 Year Treasury | CCAPM | 5.092 | -0.016 | -0.50 | 2.00 | 2.00 | 4.91 | 0.79 |
| CCAPM-AEPD | 3.605 | -0.007 | 0.05 | 0.93 | 1.24 | 4.44 | ||
| Short 3 month Treasury | CCAPM | 3.619 | -0.020 | 0.50 | 2.00 | 2.00 | 4.91 | 0.79 |
| CCAPM-AEPD | 1.818 | 0.003 | 0.01 | 0.13 | 1.36 | 4.59 | ||
| US Long Term Corporate Bond | CCAPM | 5.933 | 0.099 | 0.50 | 2.00 | 2.00 | 5.10 | 0.77 |
| CCAPM-AEPD | 4.947 | -0.043 | 0.42 | 0.86 | 0.81 | 7.51 | ||
| US Long Term Government Bond | CCAPM | 5.249 | -0.058 | 0.50 | 2.00 | 2.00 | 8.02 | 0.90 |
| CCAPM-AEPD | 4.131 | -0.012 | 0.28 | 0.87 | 0.95 | 6.59 | ||
| US Intermediate Term 5yr Government Bond | CCAPM | 5.316 | -0.069 | 0.50 | 2.00 | 2.00 | 6.89 | 0.86 |
| CCAPM-AEPD | 4.131 | -0.012 | 0.28 | 0.87 | 0.95 | 6.59 | ||
| US 30 Day Treasury Bill | CCAPM | 3.608 | -0.041 | 0.50 | 2.00 | 2.00 | 5.14 | 0.76 |
| CCAPM-AEPD | 1.783 | -0.005 | 0.00 | 1.01 | 1.44 | 4.60 | ||
| AAA Corporate Bond | CCAPM | 2.588 | 0.061 | 0.50 | 2.00 | 2.00 | 6.19 | 0.85 |
| CCAPM-AEPD | 2.450 | -0.004 | 0.49 | 1.00 | 0.78 | 5.85 | ||
| BBB Corporate Bond | CCAPM | 1.873 | 0.363 | 0.50 | 2.00 | 2.00 | 6.39 | 0.92 |
| CCAPM-AEPD | 1.654 | 0.170 | 0.42 | 0.96 | 1.01 | 6.22 |
Table III: CCAPM VS CCAPM-AEPD using total nondurable consumption growth
omitted
4. Empirical Test: CAPM-AEPD
In this section, as a supplement to the CCAPM, we examine the power of AEPD in CAPM model to probe further into the nice properties of AEPD in asset pricing models. Using the same method as in section3, we regress the excess returns of treasuries and bonds on the excess market returns of S&P 500. The result is summarized with Table IV.
As shown in Table IV, the inclusion of APED also increases the goodness of fit of the model. For CAPM-AEPD, the values of AICc are smaller than that of CAPM, which indicates a higher goodness of fit. In addition, all of the values of relative likelihood ratios are smaller than 1, which gives us the same results as we see in previous empirical test.
For coefficient values, we can see that there is little difference between the results of CAPM and the results of CAPM-AEPD. However, one thing we need pay attention to is that for some treasuries and bonds such as Baa corporate bond, 3-month T-bills and 30-day T-bills, the signs of coefficient values get changed. The possible reason is that there is no significant relationship between these treasuries and bonds and stock market, so the signs of these coefficient values make little sense. This argument can also be validated by the fact that these coefficient values are quite close to zero.
Table IV: CAPM VS CAPM-AEPD using total nondurable consumption growth
omitted
5. Concluding Remarks
This paper extends the research on asset pricing models by studying the distribution of error terms. Specifically, we replace the default normal settings of the distribution of error terms with a more flexible and sophisticated distribution-AEPD. Nice properties of AEPD in CCAPM are investigated in this paper, and the results also make sense in CAPM. AEPD allows us to conduct a more flexible and accurate simulation of the distribution of the error terms, as we can control the skewness and kurtosis. As a result, a more accurate description of the distribution of error terms gives us a better goodness of fit as shown in Table II-Table IV and thus generates a better estimation of coefficients.
Reference
[1] Breeden, Douglas T. “An intertemporal asset pricing model with stochastic consumption and investment opportunities.” Journal of financial Economics 7.3 (1979): 265-296.
[2] Sharpe, William F. “Capital asset prices: A theory of market equilibrium under conditions of risk*.” The journal of finance 19.3 (1964): 425-442.
[3] Lintner, John. “The valuation of risk assets and the selection of risky investments in stock portfolios and capital budgets.” The review of economics and statistics (1965): 13-37.
[4] Breeden, Douglas T., Michael R. Gibbons, and Robert H. Litzenberger. “Empirical tests of the consumption‐oriented CAPM.” The Journal of Finance 44.2 (1989): 231-262.
[5] Campbell, John Y., and John H. Cochrane. “Explaining the poor performance of consumption‐based asset pricing models.” The Journal of Finance 55.6 (2000): 2863-2878.
[6] Yogo, Motohiro. “A consumption‐based explanation of expected stock returns.” The Journal of Finance 61.2 (2006): 539-580.
[7] Mankiw, N. Gregory, and Stephen P. Zeldes. “The consumption of stockholders and nonstockholders.” Journal of Financial Economics 29.1 (1991): 97-112.
[8] Zhu, Dongming, and Victoria Zinde-Walsh. “Properties and estimation of asymmetric exponential power distribution.” Journal of Econometrics 148.1 (2009): 86-99.
[9] Jin, Huijie. Analysis of CAPM based on asymmetric exponential power distribution. Master dissertation, Nankai University, 2011.
Appendix
omitted